
SOURCE: CANDYSTORE.COM

Map & Data: CandyStore.com (@acandystore)
Website: Most Popular Halloween Candy By State [Interactive Map]
Beyond The Map: The Worst Halloween Candy and The Best Too
By Ben George ben@candystore.com
Halloween is back in full force this year. Yes, there will be masks. Spiderman masks! Go big this year and make sure the kids enjoy this one. To help you get the right candy, we gathered 15 years of data for this map of 2022's Most Popular Halloween Candy in the US by state.
Last year was a huge upgrade from 2020 as far as candy sales and Halloween participation in general. Not being locked down helps! This year we expect it to be full-on normal-sized Halloween again.
You've heard the disclaimers and either gotten vaxxed and boosted or decided not to. Whatever got you here, you're still here. And even if you don't plan on dressing up and getting crazy, the fact that you could if you wanted to should be cause enough for celebration this year.
Now on to business.
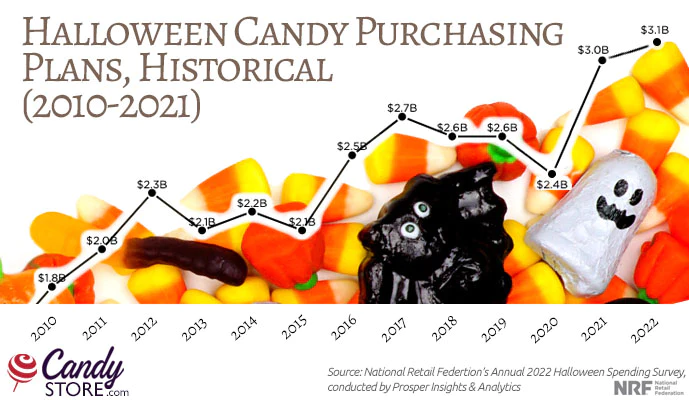
According to the National Retail Federation, Halloween candy spending should hit a whopping $3.1 Billion this year! That's a new all time high. We are back baby!
Overall Halloween spending is predicted to be over $10.6 Billion. Up 5% over last year. Bring on Halloween!
The map above reveals the results of our annual data mining, the top 3 most popular Halloween candies in each state. Hover over your state to see the goods. (Apologies, it's not interactive on mobile devices).
So enjoy the results in the fun map above. Do your state's choices surprise you? The top Halloween candy in your state are not always what you think they were. Salt water taffy and Hot Tamales performed much better than some expected, for example.
For over 15 years, we've been delivering bulk candy around the country. As bulk candy retailers and distributors, we've got a lot of candy sales data to comb through. Including some we shipped to New York in recent years...
We have seen a lot of surprising favorites and least favorites over the years. That's why working with unbiased data is so much fun. We looked at 15 years of sales data (2007-2021), looking in particular at the months leading up to Halloween. We sell nationwide (and to Canada) so we broke down our sales by state. We also have relationships with major candy manufacturers and distributors - all of whom contributed and helped us reach our conclusions.
Then we charted the best sellers in every state for Halloween. And we present it to you in the above futuristic interactive map of the most popular Halloween candy. If you'd like to see the nationwide winners, we made a graphic for that too:

As mentioned above, the National Retail Federation is estimating that shoppers will spend $3.1 billion on Halloween candy.
As you might expect, consumer confidence is way down (-18%) this year, fueled mostly by uncertainty surrounding interest rates and high inflation numbers.